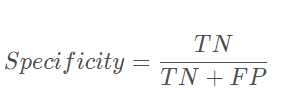
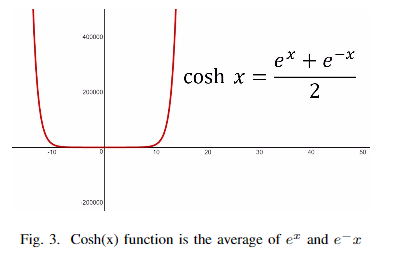
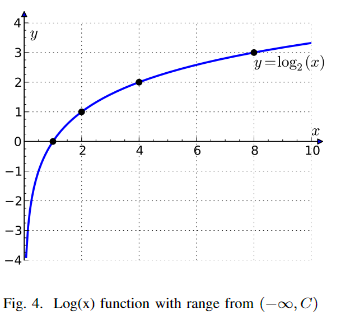
最近参加一个NLP关于医学电子病历的疾病多标签分类比赛,因为之前比较少去做NLP方向,所以,参赛纯粹是为了了解了解NLP方向,好在nlp做文本分类算是比较简单的下游任务,但在参赛过程中,会发现,其实对于文本分类来说,基本的bert-base的效果不是很好,但其实感觉不是出在模型架构方面,对于简单的分类任务,一个12层的bert应该适足以胜任了,因此需要将注意力看向数据预处理、数据清洗、数据增强。以及数据类别分布不均匀,也可以尝试使用不同的损失函数。另外,不可否认,输入的文本长度越长,效果应该会更好一些,但奈何没有“钞”能力。此外,还可以尝试模型集成、交叉验证(五折交叉验证,即:将训练集分为五部分,一部分做验证集,剩下四部分做训练集,相当于得到五个模型。验证集组合起来就是训练集。五个模型对测试集的预测取均值得到最终的预测结果。)这块的思路还挺多的,算是做个记录,方便后面在处理类似文本分类任务时候的一个参考。
言归正传:今天来总结下NLP中的数据处理。
1、数据清洗
什么是数据清洗:
数据清洗是指发现并纠正数据文件中可识别的错误的最后一道程序,包括检查数据一致性,处理无效值和缺失值等。与问卷审核不同,录入后的数据清理一般是由计算机而不是人工完成。数据清洗从名字上也看的出就是把“脏”的“洗掉”,指发现并纠正数据文件中可识别的错误的最后一道程序,包括检查数据一致性,处理无效值和缺失值等。
为什么要进行数据清洗
因为数据仓库中的数据是面向某一主题的数据的集合,这些数据从多个业务系统中抽取而来而且包含历史数据,这样就避免不了有的数据是错误数据、有的数据相互之间有冲突,这些错误的或有冲突的数据显然是我们不想要的,称为“脏数据”。我们要按照一定的规则把“脏数据”“洗掉”,这就是数据清洗。
清洗后,一个数据集应该与系统中其他类似的数据集保持一致。 检测到或删除的不一致可能最初是由用户输入错误、传输或存储中的损坏或不同存储中类似实体的不同数据字典定义引起的。 数据清理与数据确认(data validation)的不同之处在于,数据确认几乎总是意味着数据在输入时被系统拒绝,并在输入时执行,而不是执行于批量数据。
数据清洗不仅仅更正错误,同样加强来自各个单独信息系统不同数据间的一致性。专门的数据清洗软件能够自动检测数据文件,更正错误数据,并用全企业一致的格式整合数据。
数据清洗流程:
(1)中文首先需要分词,可以采用结巴分词、HanNLP、刨丁解牛等分词工具;
(2)数据规范化处理(Normalization):比如通常会把文本中的大写转成小写,清除文本中的句号、问号、感叹号等特殊字符,并且仅保留字母表中的字母和数字。小写转换和标点移除是两个最常见的文本 Normalization 步骤。是否需要以及在哪个阶段使用这两个步骤取决于你的最终目标。
去除一些停用词。而停用词是文本中一些高频的代词、连词、介词等对文本分类无意义的词,通常维护一个停用词表,特征提取过程中删除停用表中出现的词,本质上属于特征选择的一部分。具体可参考Hanlp的停用词表https://github.com/hankcs/HanLP
(3)Tokenization,Token 是“符号”的高级表达。一般指具有某种意义,无法再分拆的符号。在英文自然语言处理中,Tokens 通常是单独的词。因此,Tokenization 就是将每个句子分拆成一系列词。可以使用NLTK工具箱来完成相关操作。
(4)Stop Word 是无含义的词,例如 ‘is’/‘our’/‘the’/‘in’/‘at’ 等。它们不会给句子增加太多含义,单停止词是频率非常多的词。 为了减少我们要处理的词汇量,从而降低后续程序的复杂度,需要清除停止词。
(5)Part-of-Speech Tagging:还记得在学校学过的词性吗?名词、代词、动词、副词等等。识别词在句子中的用途有助于我们更好理解句子内容。并且,标注词性还可以明确词之间的关系,并识别出交叉引用。同样地,NLTK 给我们带来了很多便利。你可以将词传入 PoS tag 函数。然后对每个词返回一个标签,并注明不同的词性。
(6)Named Entity 一般是名词短语,又来指代某些特定对象、人、或地点 可以使用 ne_chunk()方法标注文本中的命名实体。在进行这一步前,必须先进行 Tokenization 并进行 PoS Tagging。
(7)Stemming and Lemmatization:为了进一步简化文本数据,我们可以将词的不同变化和变形标准化。Stemming 提取是将词还原成词干或词根的过程。
(8)一些词在句首句尾句中出现的概率不一样,统计N-GRAM特征的时候要在句首加上BOS,句尾加上EOS作标记。
(9)把长文本分成句子和单词这些fine granularity会比较有用。
(10) 一般会有一个dictionary,不在dictionary以内的单词就用UNK取代。
(11)单词会被转成数字(它对应的index,从0开始,一般0就是UNK)。
(12)做机器翻译的时候会把单词转成subword units。
这块的代码还是比较多
1、A Python toolkit for file processing, text cleaning and data splitting. 文件处理,文本清洗和数据划分的python工具包。
数据增强
与计算机视觉中使用图像进行数据增强不同,NLP中文本数据增强是非常罕见的。这是因为图像的一些简单操作,如将图像旋转或将其转换为灰度,并不会改变其语义。语义不变变换的存在使增强成为计算机视觉研究中的一个重要工具。
方法
1. 词汇替换
这一类的工作,简单来说,就是去替换原始文本中的某一部分,而不改变句子本身的意思。
1.1 基于同义词典的替换
在这种方法中,我们从句子中随机取出一个单词,将其替换为对应的同义词。例如,我们可以使用英语的 WordNet 数据库来查找同义词,然后进行替换。WordNet 是一个人工维护的数据库,其中包含单词之间的关系。
Zhang 等人在2015年的论文 “Character-level Convolutional Networks for Text Classification” 中使用了这种方法。Mueller 等人也使用类似的方法为他们的句子相似度模型生成额外的 10K 条训练数据。这一方法也被 Wei 等人在他们的 “Easy Data Augmentation” 论文中使用。对于如何使用,NLTK 提供了对 WordNet 的接口;我们还可以使用 TextBlob API。此外,还有一个名为 PPDB 的数据库,其中包含数百万条同义词典,可以通过编程方式下载和使用。
1.2 基于 Word-Embeddings 的替换
在这种方法中,我们采用预先训练好的词向量,如 Word2Vec、GloVe、FastText,用向量空间中距离最近的单词替换原始句子中的单词。Jiao 等人在他们的论文 “TinyBert” 中使用了这种方法,以改进语言模型在下游任务上的泛化性;Wang 等人使用它来对 tweet 语料进行数据增强来学习主题模型。
例如,可以用三个向量空间中距离最近的单词替换原始句子中的单词,可以得到原始句子的三个变体。我们可以使用像 Gensim 包来完成这样的操作。在下面这个例子中,我们通过在 Tweet 语料上训练的词向量找到了单词 “awesome” 的同义词。

1.3 基于 Masked Language Model 的替换
像 BERT、ROBERTA 和 ALBERT 这样基于 Transformer 的模型已经使用 “Masked Language Modeling” 的方式,即模型要根据上下文来预测被 Mask 的词语,通过这种方式在大规模的文本上进行预训练。
Masked Language Modeling 同样可以用来做文本的数据增强。例如,我们可以使用一个预先训练好的 BERT 模型,然后对文本的某些部分进行 Mask,让 BERT 模型预测被 Mask 的词语。我们称这种方法叫 Mask Predictions。和之前的方法相比,这种方法生成的文本在语法上更加通顺,因为模型在进行预测的时候考虑了上下文信息。我们可以很方便的使用 HuggingFace 的 transfomers 库,通过设置要替换的词语并生成预测来做文本的数据增强。


1.4 基于 TF-IDF 的替换
这种数据增强方法是 Xie 等人在 “Unsupervised Data Augmentation” 论文中提出来的。其基本思想是,TF-IDF 分数较低的单词不能提供信息,因此可以在不影响句子的基本真值标签的情况下替换它们。

具体如何计算整个文档中单词的 TF-IDF 分数并选择最低的单词来进行替换,可以参考作者公开的代码。
2. Back Translation(回译)
在这种方法中,我们使用机器翻译的方法来复述生成一段新的文本。Xie 等人使用这种方法来扩充未标注的样本,在 IMDB 数据集上他们只使用了 20 条标注数据,就可以训练得到一个半监督模型,并且他们的模型优于之前在 25000 条标注数据上训练得到的 SOTA 模型。
使用机器翻译来回译的具体流程如下:
- 找一些句子(如英语),翻译成另一种语言,如法语
- 把法语句子翻译成英语句子
- 检查新句子是否与原来的句子不同。如果是,那么我们使用这个新句子作为原始文本的补充版本。

我们还可以同时使用多种不同的语言来进行回译以生成更多的文本变体。如下图所示,我们将一个英语句子翻译成目标语言,然后再将其翻译成三种目标语言:法语、汉语和意大利语。

这种方法也在 Kaggle 上的 “Toxic Comment Classification Challenge” 的第一名解决方案中使用。获胜者将其用于训练数据扩充和测试,在应用于测试的时候,对英语句子的预测概率以及使用三种语言(法语、德语、西班牙语)的反向翻译进行平均,以得到最终的预测。
对于如何实现回译,可以使用 TextBlob 或者谷歌翻译。
3. Text Surface Transformation
这些是使用正则表达式应用的简单模式匹配变换,Claude Coulombe 在他的论文中介绍了这些变换的方法。
在论文中,他给出了一个将动词由缩写形式转换为非缩写形式的例子,我们可以通过这个简单的方法来做文本的数据增强。

需要注意的是,虽然这样的转换在大部分情况下不会改变句子原本的含义,但有时在扩展模棱两可的动词形式时可能会失败,比如下面这个例子:

为了解决这一问题,论文中也提出允许模糊收缩 (非缩写形式转缩写形式),但跳过模糊展开的方法 (缩写形式转非缩写形式)。
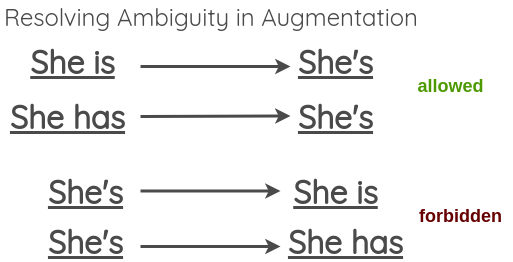
我们可以在这里找到英语缩写的列表。对于展开,可以使用 Python 中的 contractions 库。
4. Random Noise Injection
这些方法的思想是在文本中注入噪声,来生成新的文本,最后使得训练的模型对扰动具有鲁棒性。
4.1 Spelling error injection
在这种方法中,我们在句子中添加一些随机单词的拼写错误。可以通过编程方式或使用常见拼写错误的映射来添加这些拼写错误,具体可以参考这个链接。
4.2 QWERTY Keyboard Error Injection
这种方法试图模拟在 QWERTY 键盘布局上打字时由于键之间非常接近而发生的常见错误。这种错误通常是在通过键盘输入文本时发生的。
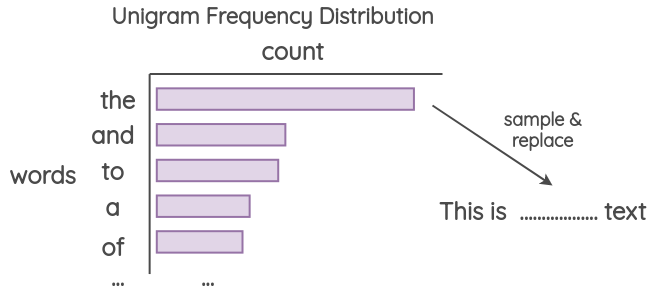
4.3 Unigram Noising
这种方法已经被 Xie 等人和 UDA 的论文所使用,其思想是使用从 unigram 频率分布中采样的单词进行替换。这个频率基本上就是每个单词在训练语料库中出现的次数。
4.4 Blank Noising
该方法由 Xie 等人在他们的论文中提出,其思想是用占位符标记替换一些随机单词。本文使用 “_” 作为占位符标记。在论文中,他们使用它作为一种避免在特定上下文上过度拟合的方法以及语言模型平滑的机制,这项方法可以有效提高生成文本的 Perplexity 和 BLEU 值。
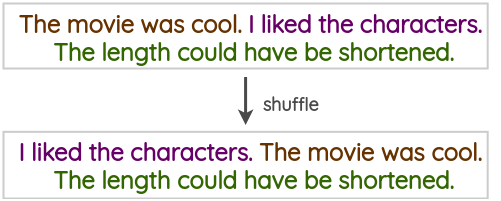
4.5 Sentence Shuffling
这是一种很初级的方法,我们将训练样本中的句子打乱,来创建一个对应的数据增强样本。
4.6 Random Insertion
这个方法是由 Wei 等人在其论文 “Easy Data Augmentation” 中提出的。在该方法中,我们首先从句子中随机选择一个不是停止词的词。然后,我们找到它对应的同义词,并将其插入到句子中的一个随机位置。(也比较 Naive)

4.7 Random Swap
这个方法也由 Wei 等人在其论文 “Easy Data Augmentation” 中提出的。该方法是在句子中随机交换任意两个单词。

4.8 Random Deletion
该方法也由 Wei 等人在其论文 “Easy Data Augmentation” 中提出。在这个方法中,我们以概率 p 随机删除句子中的每个单词。

5. Instance Crossover Augmentation
这种方法由 Luque 在他 TASS 2019 的论文中介绍,灵感来自于遗传学中的染色体交叉操作。
在该方法中,一条 tweet 被分成两半,然后两个相同情绪类别(正/负)的 tweets 各自交换一半的内容。这么做的假设是,即使结果在语法和语义上不健全,新的文本仍将保留原来的情绪类别。
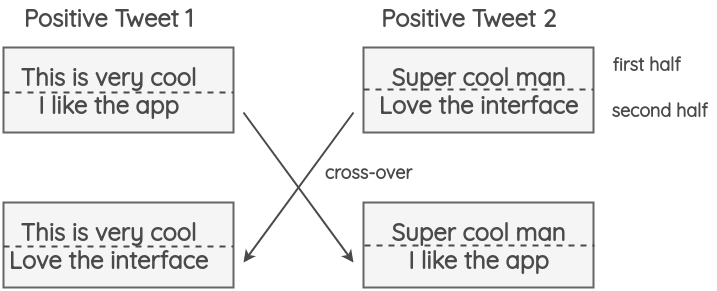
这中方法对准确性没有影响,并且在 F1-score 上还有所提升,这表明它帮助了模型提升了在罕见类别上的判断能力,比如 tweet 中较少的中立类别。

6. Syntax-tree Manipulation
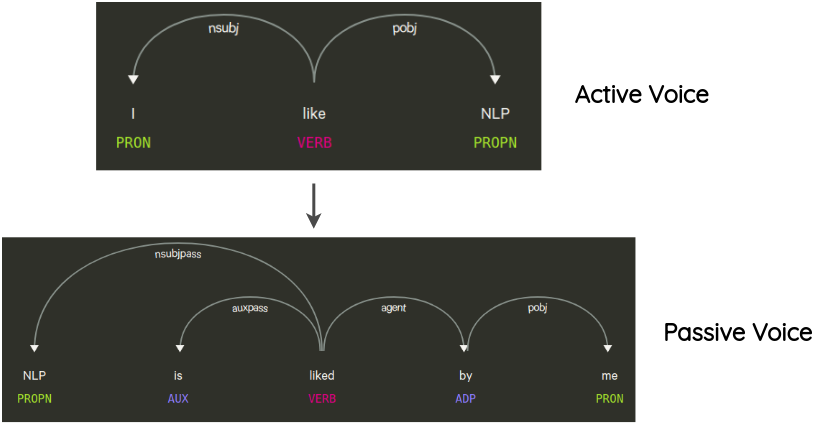
这种方法最先是由 Coulombe 提出的,其思想是解析并生成原始句子的依赖树,使用规则对其进行转换来对原句子做复述生成。
例如,一个不会改变句子意思的转换是句子的主动语态和被动语态的转换。
7. MixUp for Text
Mixup 是 Zhang 等人在 2017 年提出的一种简单有效的图像增强方法。其思想是将两个随机图像按一定比例组合成,以生成用于训练的合成数据。对于图像,这意味着合并两个不同类的图像像素。它在模型训练的时候可以作为的一种正则化的方式。

为了把这个想法带到 NLP 中,Guo 等人修改了 Mixup 来处理文本。他们提出了两种将 Mixup 应用于文本的方法:
7.1 wordMixup
在这种方法中,在一个小批中取两个随机的句子,它们被填充成相同的长度;然后,他们的 word embeddings 按一定比例组合,产生新的 word embeddings 然后传递下游的文本分类流程,交叉熵损失是根据原始文本的两个标签按一定比例计算得到的。

7.2 sentMixup
在这种方法中,两个句子首先也是被填充到相同的长度;然后,通过 LSTM/CNN 编码器传递他们的 word embeddings,我们把最后的隐藏状态作为 sentence embedding。这些 embeddings 按一定的比例组合,然后传递到最终的分类层。交叉熵损失是根据原始文本的两个标签按一定比例计算得到的。

8. 生成式的方法
这一类的工作尝试在生成额外的训练数据的同时保留原始类别的标签。
Conditional Pre-trained Language Models
这种方法最早是由 Anaby-Tavor 等人在他们的论文 “Not Enough Data? Deep Learning to the Rescue!” Kumar 等人最近的一篇论文在多个基于 Transformer 的预训练模型中验证了这一想法。
问题的表述如下:
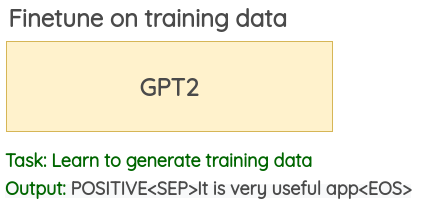
- 在训练数据中预先加入类别标签,如下图所示。

2. 在这个修改过的训练数据上 finetune 一个大型的预训练语言模型 (BERT/GPT2/BART) 。对于 GPT2,目标是去做生成任务;而对于 BERT,目标是要去预测被 Mask 的词语。
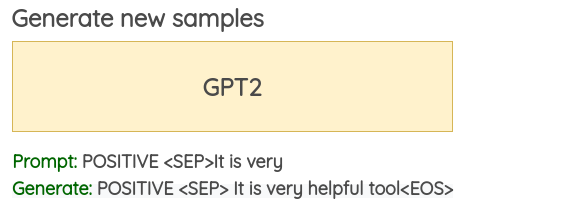
3. 使用经过 finetune 的语言模型,可以使用类标签和几个初始单词作为模型的提示词来生成新的数据。本文使用每条训练数据的前 3 个初始词来为训练数据做数据增强。
9. 实现过程
nlpaug 和 textattack 等第三方 Python 库提供了简单易用的 API,可以轻松使用上面介绍的 NLP 数据增强方法。
1、 NLP Chinese Data Augmentation 一键中文数据增强工具: https://github.com/425776024/nlpcda
使用:pip install nlpcda
介绍
一键中文数据增强工具,支持:
- 1.随机实体替换
- 2.近义词
- 3.近义近音字替换
- 4.随机字删除(内部细节:数字时间日期片段,内容不会删)
- 5.NER类
BIO数据增强 - 6.随机置换邻近的字:研表究明,汉字序顺并不定一影响文字的阅读理解<<是乱序的
- 7.中文等价字替换(1 一 壹 ①,2 二 贰 ②)
- 8.翻译互转实现的增强
- 9.使用
simbert做生成式相似句生成
2、 TextAttack 是一个可以实行自然语言处理的Python 框架,用于方便快捷地进行对抗攻击,增强数据,以及训练模型。https://github.com/QData/TextAttack/blob/master/README_ZH.md
文档:https://textattack.readthedocs.io/en/latest/0_get_started/basic-Intro.html
4、中文谐音词/字库
10. 结论
通过阅读许多 NLP 数据增强方面的论文,我发现大多数方法都是具有很强的任务属性的,并且针对这些方法的实验也只在某些特定的场景进行了验证。可以见得,系统地比较这些方法并且分析它们在其他任务上的表现在未来将是一项有趣的研究。


